

When applying OLS regression or related statistics (e.g. F-test), there are certain assumptions that are essential for a robust and unbiased model. The normality assumption is one of them. We expect the error terms to be normally distributed. In many cases, outlying data points are the reason for non-normality.
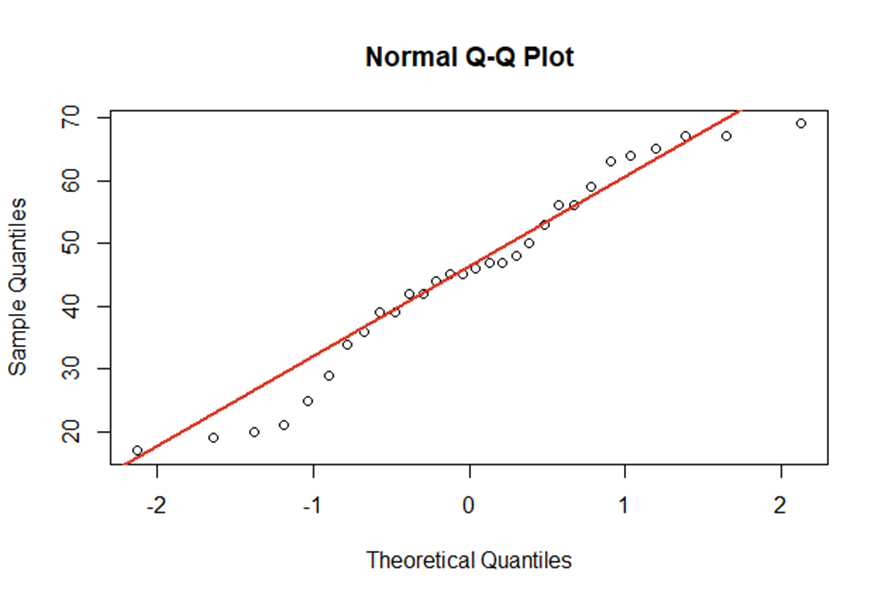
There are many graphical ways to identify non-normality with plots. For instance, QQ-plots show the empirical quantiles vs. the theoretical quantiles of a normal distribution. The better our empirical data points fit the red line, the closer is our data to a normal distribution.
As already shown, visualisations are perfect for getting a first overview of the data. However, you should also consider test statistics with \(\small{ H_0:\ \varepsilon_i\sim N }\) and \(\small{ H_1: \varepsilon_i\sim D_0\neq\ N }\).
Two important test statistics are the Kolmogorov-Smirnow test and the Jarque-Bera test.