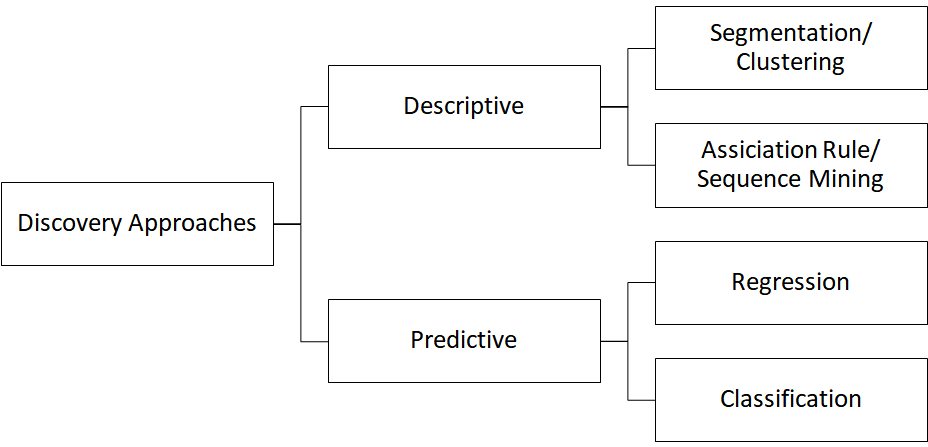
The first branch of knowledge discovery in data bases is the field of descriptive analytics. In this section, I will set the focus on clustering algorithms.
Cluster Analysis
The cluster analysis is a powerful tool often used in marketing to identify homogeneity or certain similarities within data sets. The aim is to create (sub-)groups with as much homogeneity within these groups and as much differentiation between the segments as possible:
- maximal intra-cluster homogeneity
- maximal inter-cluster heterogeneity
Clustering Algorithms
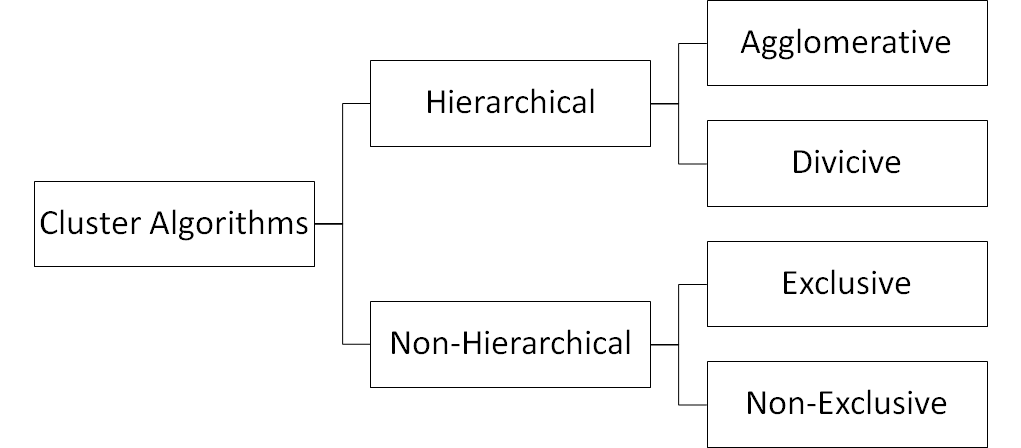
The hierarchical clustering approach uses iterative algorithms to form cluster solutions. You can either start with one huge cluster and then iteratively split them into smaller ones (divicive) or you begin with a bottom-up approach, that is having every data point in one’s own cluster and then iteratively merge cases into larger clusters.
Here, the focus is set on a non-hierarchical, exclusive, clustering algorithm: K-Means
The K-Means-algorithm is very popular and assigns every case to exactly one cluster. Let’s have a look at the algorithm in pseudo code:
Input:
K 	//number of clusters
DP[1..n]	//Set of n DataPoints

Algorithm:
Randomly choose k objects of DP as initial cluster centroids
Repeat:
   1. Assign all remaining n-k cases to the cluster with most similarity (least distance)
   2. Update: Calculate intra-cluster mean and choose (new) centroid which is closest to the mean.
Until: No more change in cluster assignment

Output:
Set of k clusters of n DataPoints
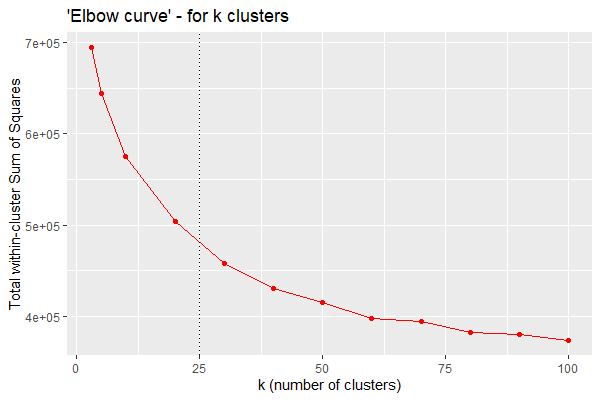
Finding the best k
The number of clusters is predefined by the data scientist. The more clusters we define, the better will be the segmentation of this data. In the extreme scenario, every data point is assigned in a new cluster. However, a model that has learned the training data “by heart” is not suitable for new data, because there is too much noise included.
Literature states that a lack of generalisation leads to bad predictions on new data. Therefore, it is necessary to find the sweet spot (k*) with a low error rate on the one hand and enough level of abstraction for new testing data.
Elbow-Curve
A graphical approach to estimate k* is the so-called Elbow-curve. By plotting the total within-cluster Sum of Squares (error terms) against the number of clusters k, we get this nice curve that often reminds of an elbow. The best setting for k lies directly in the elbow.